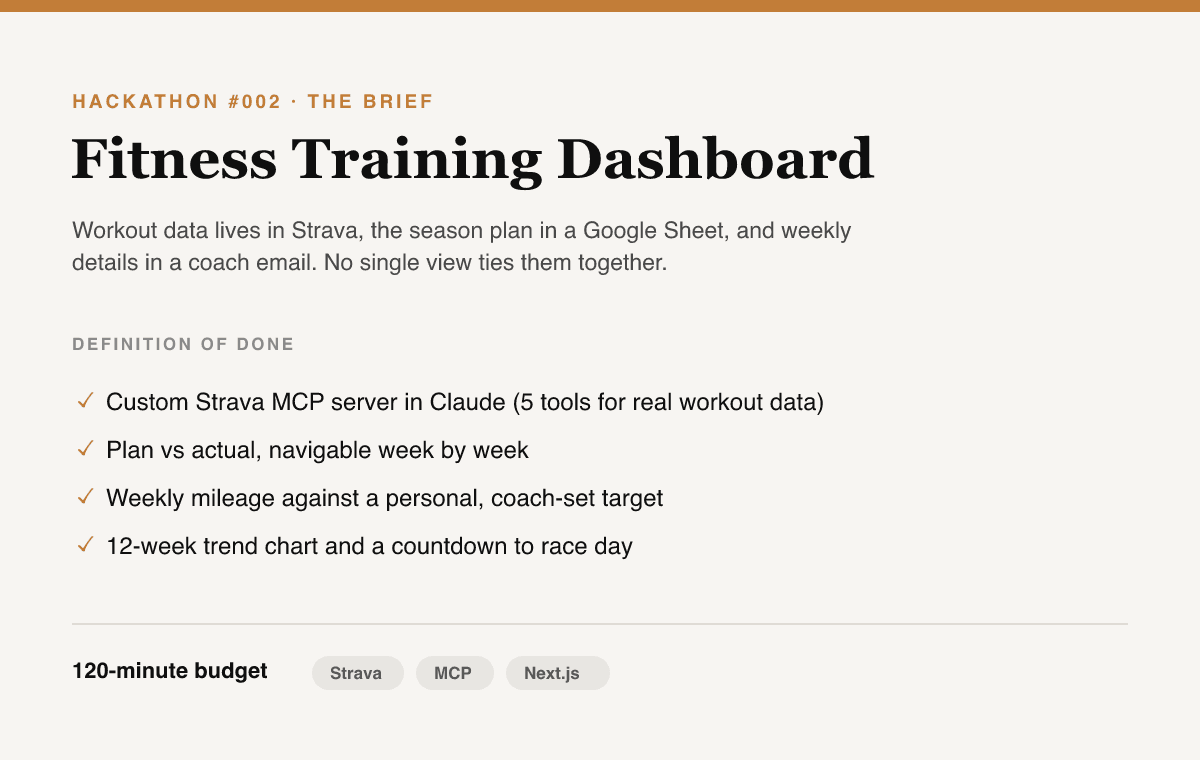
Fitness Training Dashboard
Combining disparate training sources into one dashboard for faster workout analysis, with the plan and the actuals side by side.
Context
Too much time was spent looking across separate systems to figure out how to best prepare for races and increase my fitness. The data was disjointed and toggling between apps was confusing and a pain. I wanted a single place to see how my body was actually progressing, and how to adjust what's coming.
Challenge
Connect three data sources to pull in historical metrics and plan future workouts. Strava owned my workout data, Google Sheets had my multi-month training plan, and my coach sent a weekly email outlining changes to the plan. On top of that, I wanted an AI coach to analyze my performance and recommend adjustments for my next workout.
Execution
Built a custom Strava MCP server (5 tools) so Claude can pull real workout data in real time instead of guessing.
Added individual workout analysis so any completed session can be selected and reviewed by a Claude-powered coach that explains how the workout went and what to adjust next time.
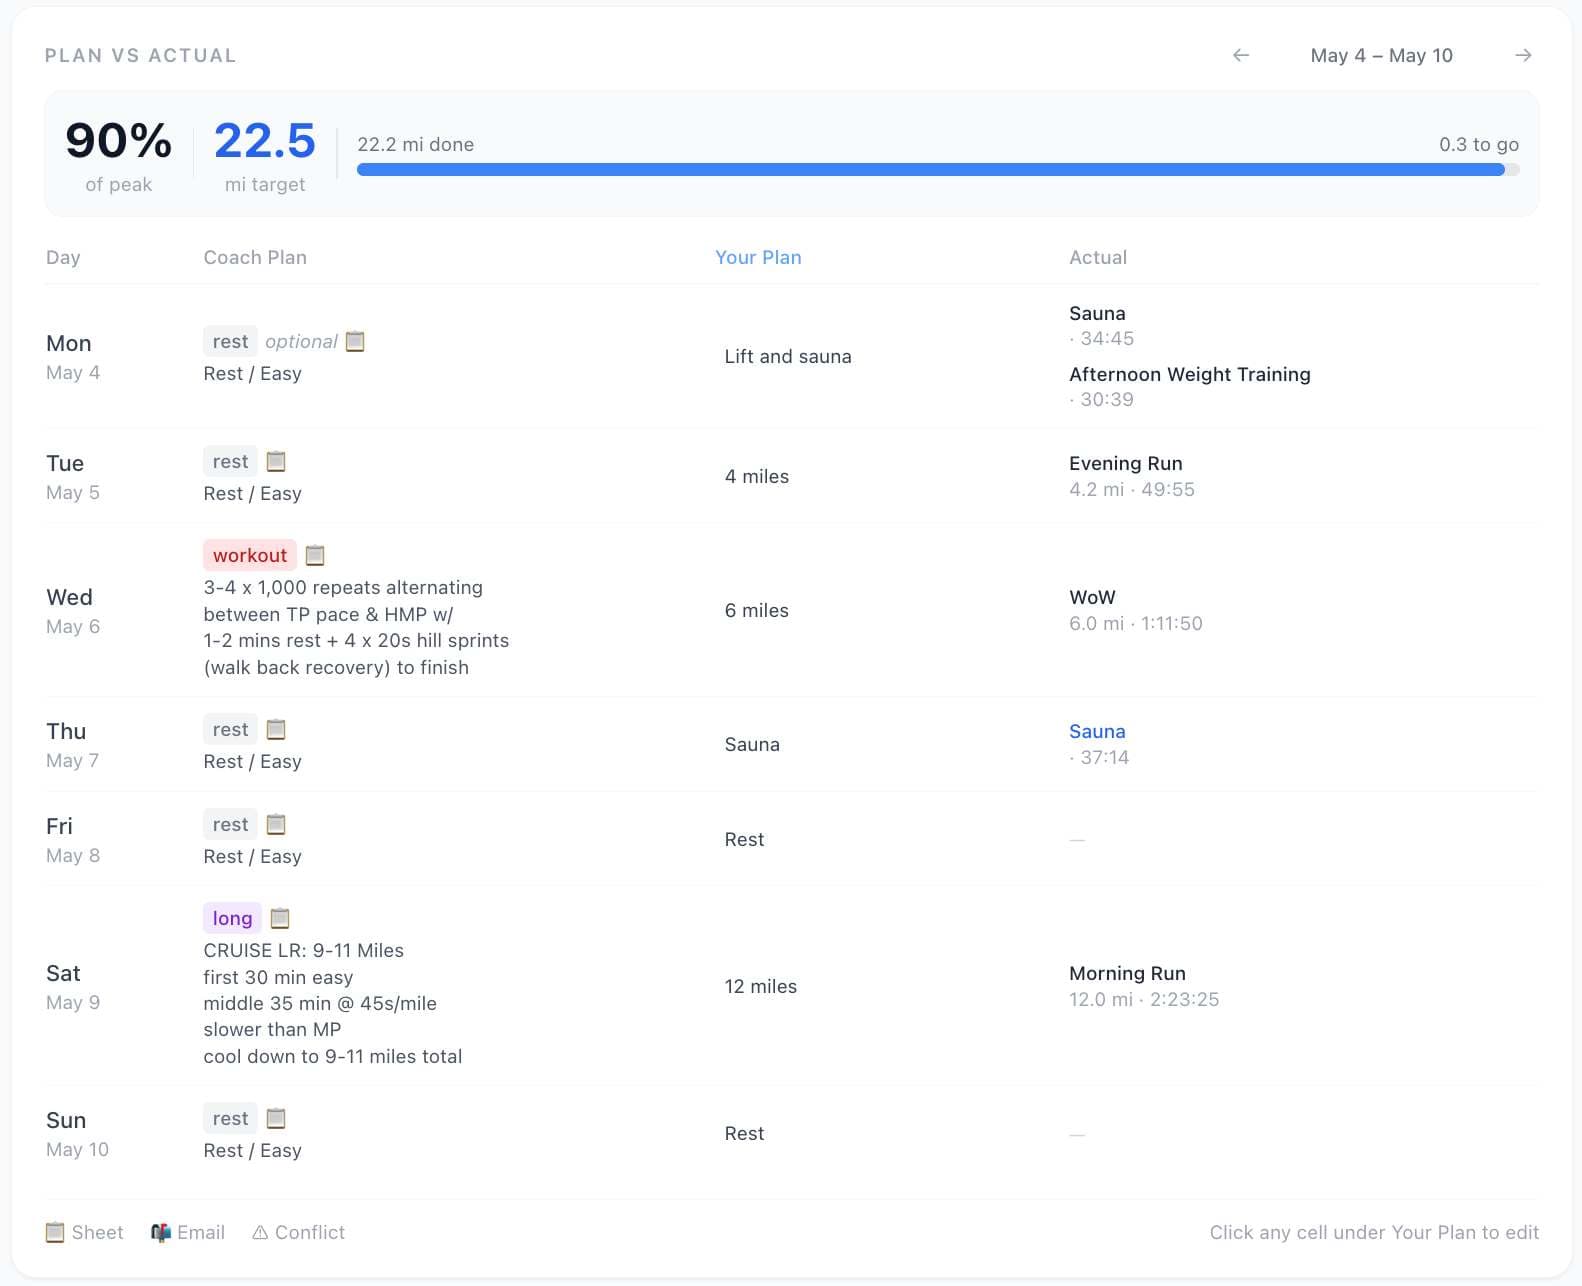
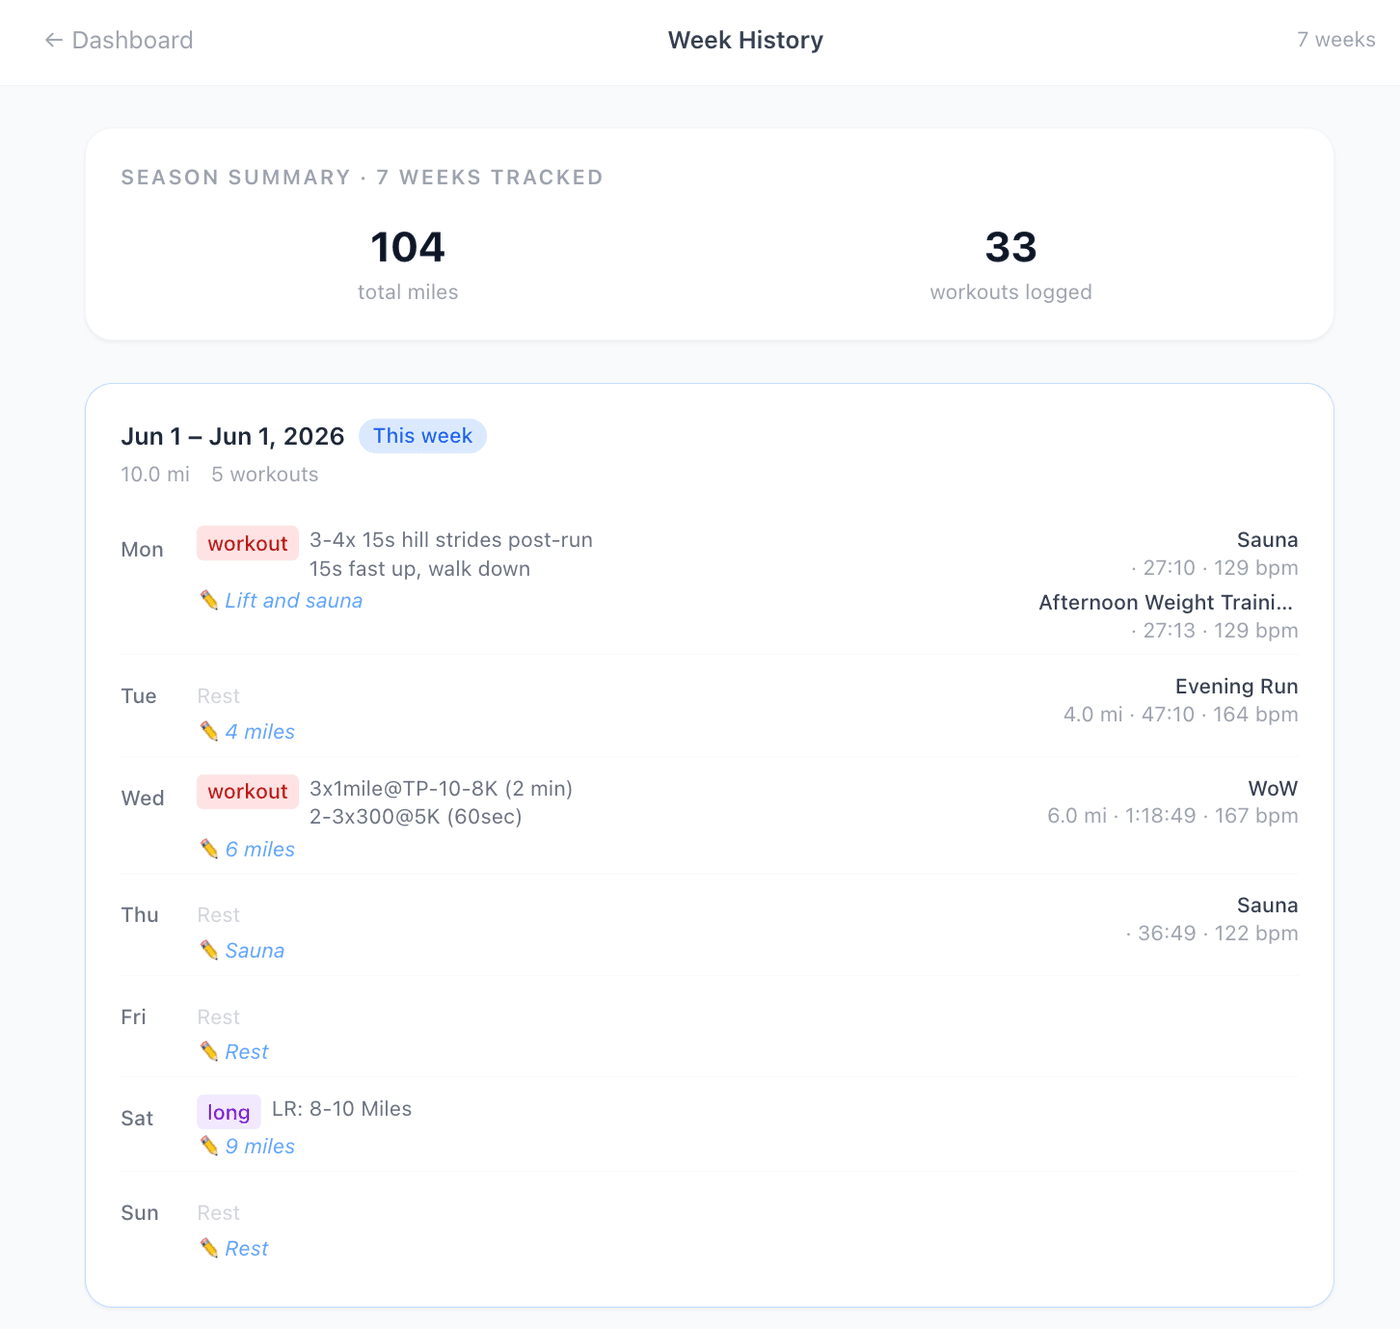
Parse a 16+ week Google Sheet (every mesocycle, weekly workout, and long run) into a week-keyed map you can page through, forward to any planned week or back across the season.
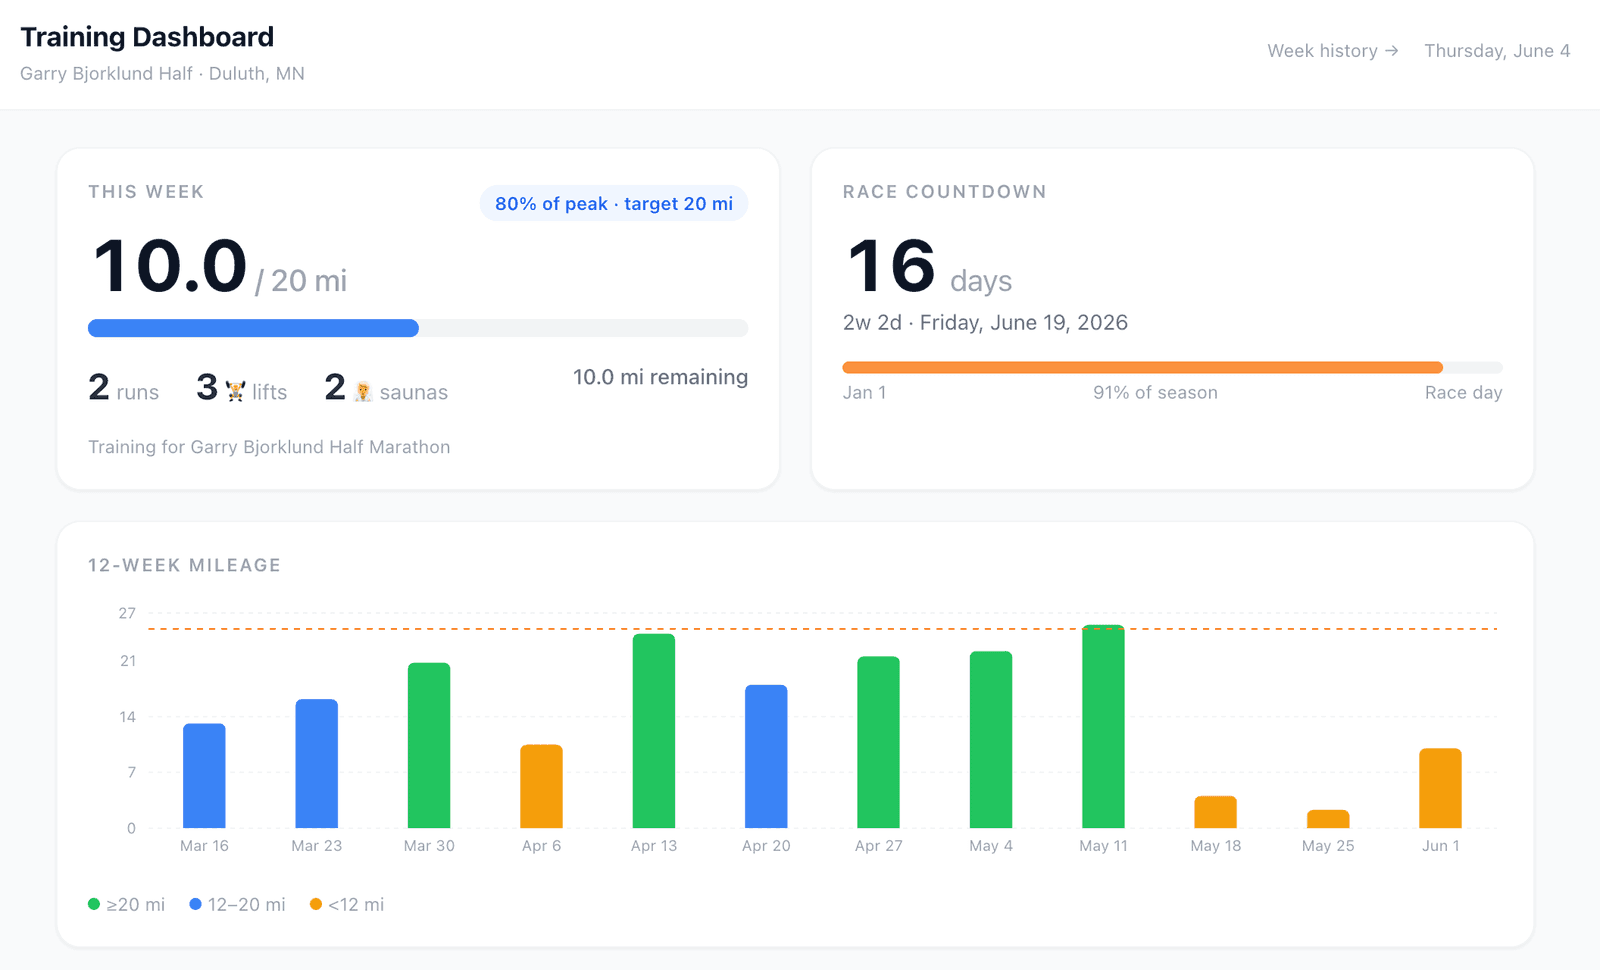
Each week's mileage goal comes straight from the coach's "percent of peak" in the sheet, scaled to my peak, so an 80% week reads as a 20-mile target. That one number kept every week personal and focused on exactly what I needed right then, instead of getting lost in the sauce or staring too far down the season.
Hardened three live integrations against real-world failure modes: credential formatting, server-side URL resolution, and API rate limits.
Work


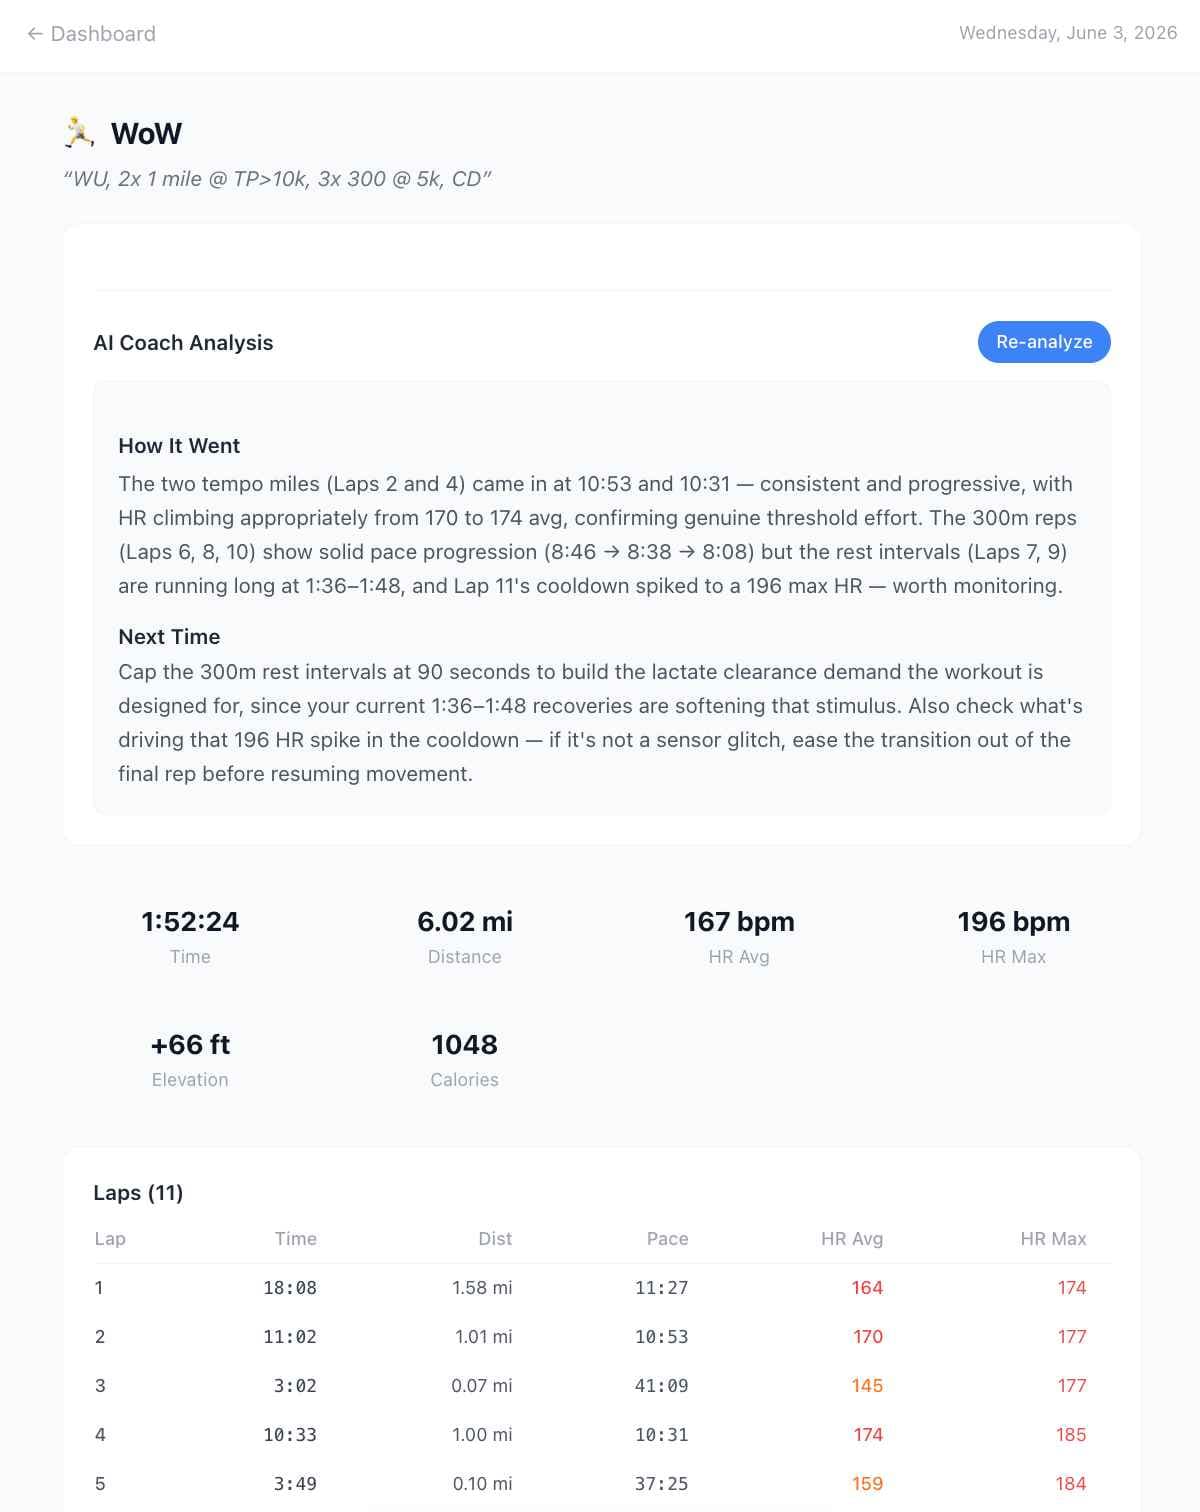
Individual workouts can be selected and analyzed by a Claude-powered coach, with a plain-language read on how the workout went and recommendations for next time.
Next case study